
Procedural Art: Drawing a Black-and-White Checkerboard with Code
Author: Shiguang
Reviewed by: Dongda
Many readers probably first encountered “procedural art” in an elementary-school information technology class, when a textbook introduced the fascinating program Turtle Graphics. Think back: how did we make the little turtle move? The answer was code. In 1996, Seymour Papert and Wally Feurzeig invented Logo, a language designed to teach children programming, and we used it to direct a turtle around the screen as it drew. As technology has evolved, however, Logo has gradually faded from view, and mainstream approaches to drawing have changed as well.
This article shows how to use a shader language—called simply Shader below—to draw a 3*3 checkerboard. I use UE4 for the demonstration. If you are interested, try the algorithm presented here in Unity or on an online rendering site such as ShaderToy.
Why begin a series on procedural art with a checkerboard? It is one of the more basic procedural-art exercises: the algorithm is straightforward, and the result is easy to work out. That makes it approachable for readers who are interested in Shader but do not know it well. Because the article does involve some technical terms, however, it is recommended for readers with some background in computer graphics. With that said, let's get started.
Getting Started
Open UE4's powerful Shader Graph and get ready to draw. First, connect the texcoord node—a set of texture coordinates—to base color on the output root node. The result looks like this:
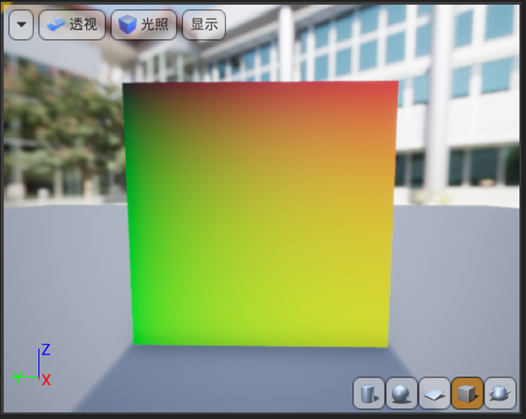
What exactly are we looking at, and where did it come from? (It really does look like some kind of fruit.) First, remember that the texcoord node stores a set of texture coordinates ranging from 0 to 1. If we take the upper-left corner of the rectangle in Figure 1 as the origin and point the y-axis downward, the texcoord coordinate (0, 0) refers to the upper-left corner, while (1, 1) refers to the lower-right. We have also connected the texcoord node to base color, which expects a Vector3 value—the three RGB components—as its output. Texture coordinates are Vector2 values, so they are one component short. Fortunately, the engine automatically supplies 0 as the third component. The color at the upper-left is therefore (0, 0, 0), or black, while the color at the lower-right is (1, 1, 0), or yellow.
We can test this idea by manually setting the third component to “1.” Feeding this value into base color produces the result shown below. Here, the output at the upper-left is (0, 0, 1), while the output at the lower-right is (1, 1, 1), just as expected.
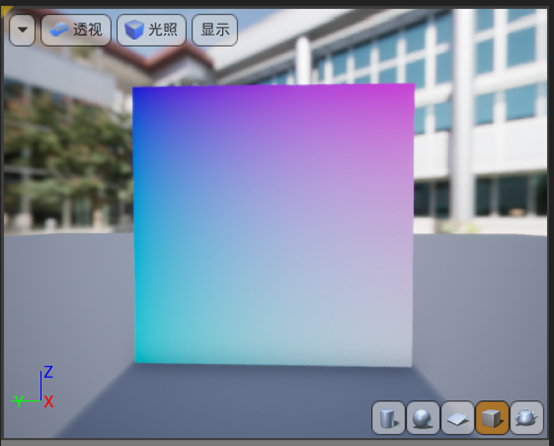
Working Through the Math
Our data now varies continuously. To produce distinct checkerboard squares, we need to turn that continuous data into discrete “steps.” We can do this with the Floor function, which rounds each coordinate down. This gives us one segment of data, but we need three rows and three columns. Multiplying by 3 produces three segments, as shown below:
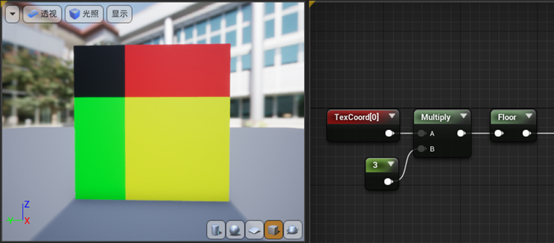
The result does not look quite right. Any color component above 1 is treated as 1, so several regions appear identical. The data for the lower-right square is actually (2, 2, 0), but its displayed output is (1, 1, 0), which is yellow. Dividing the data by 2 gives all nine squares distinct colors, as shown below:
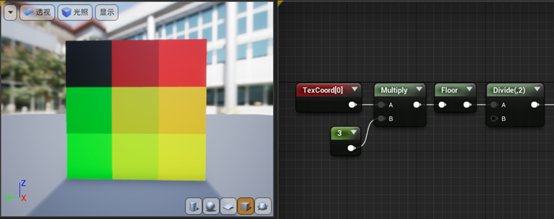
We are now close to the final result. Here is the data for each square on the current board:
1 | (0, 0, 0) (0.5. 0, 0) (1, 0, 0) |
You have probably spotted the interesting pattern. If we output only the R-channel value of each square, we get vertical stripes in black, gray, and white, as shown below. If we output only the G-channel value, we get horizontal stripes in the same three colors:
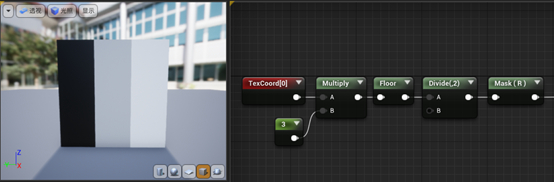
Could we create the checkerboard simply by adding the R and G channels? No—we would get the result shown below:
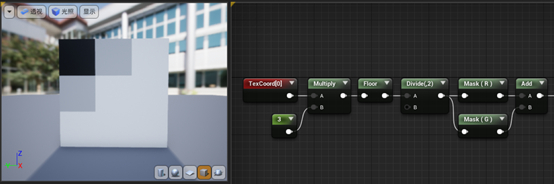
The result is disappointing because every component above the limit is automatically clamped to 1. Our draft checkerboard also contains gray squares, but we want a black-and-white board whose final output can only be (0, 0, 0) or (1, 1, 1). How can we achieve that? At this point, the mathematical result for the nine-square grid looks like this:
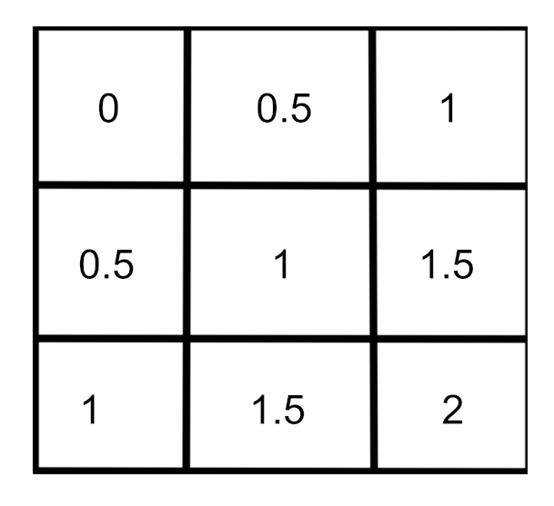
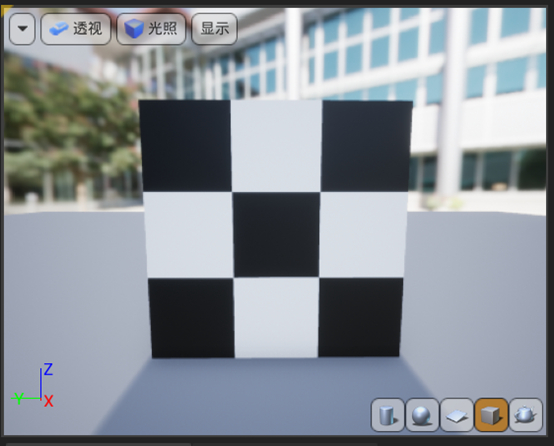
Taking only the fractional part now gives us a fairly good “gray-and-white checkerboard.” To turn it into a black-and-white checkerboard, simply multiply the gray value (0.5, 0.5, 0.5) by 2. The final result is shown below. To increase the number of rows and columns, multiply texcoord by a larger value before applying the floor operation.
All articles in this blog are licensed under CC BY-NC-SA 4.0 unless stating additionally.
 爱发电(点击图片跳转)