
Stars: The Fundamentals of Stellar Astronomy
Author: 栗小白 (SDU)
Reviewer: 时光
Preface
Because this is “popular science,” we will not venture into unfathomable black holes, quantum mechanics, or M-theory—though I make no promises about next time. Nor will I try to scare anyone with impenetrable mathematical symbols or jargon. You can trust me on that, because my own math is not very good. There are not even any formulas, mainly because they are too hard to print. This article covers only the most, most, most, most fundamental concepts about stars and how we study them, leaving plenty of other aspects aside. Let us begin.
Part 1: Luminosity and Apparent Brightness
As their names suggest, luminosity and apparent brightness both describe how bright a star is. The two are related, but they are not the same quantity.
Differences
- Luminosity is an intrinsic property of a star. It does not depend on the observer’s position or velocity and is also called absolute brightness.
- Apparent brightness measures the energy flux received from a star at Earth—the amount of energy arriving per unit area per unit time.
Relationship
You could figure this out in your sleep: apparent brightness must depend on how bright the star really is—its luminosity—and on its distance from us. How does distance enter the picture? Through yet another inverse-square law. The diagram below makes the relationship easy to see.
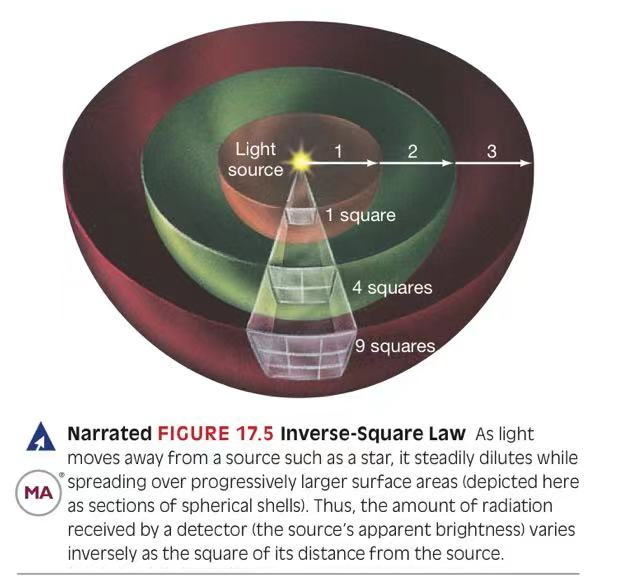
In short, a star’s apparent brightness is proportional to its luminosity and inversely proportional to the square of its distance.
Astronomy enthusiasts have probably used planetarium software to explore the night sky and already have at least a rough idea of what stellar magnitudes mean. Still, no popular science article on the subject would be complete without a proper introduction to apparent magnitude.
Like the rest of us, astronomers usually express apparent brightness on the apparent-magnitude scale rather than in the SI unit W/m². The concept dates back to the second century BCE and the astronomer Hipparchus. He originally divided stars into six magnitudes—1, 2, 3, 4, 5, and 6. As science and technology advanced, the modern scale expanded far beyond those six classes. An apparent magnitude can be fractional, greater than 6, or even negative. The basic rule remains the same: the smaller the number, the greater the apparent brightness.
Imagine an intrinsically bright star that lies extremely far from Earth. Its apparent magnitude may make it look fainter than a dim star nearby. Is there a way to compare the stars’ own luminosities objectively? There is: absolute magnitude. This is the apparent magnitude an object would have if placed at a specified distance of 10 parsecs. Absolute magnitude lets us compare luminosities without distance affecting the result.
Part 2: Stellar Temperature
Star charts show stars in different colors, and those colors tell us their temperatures.
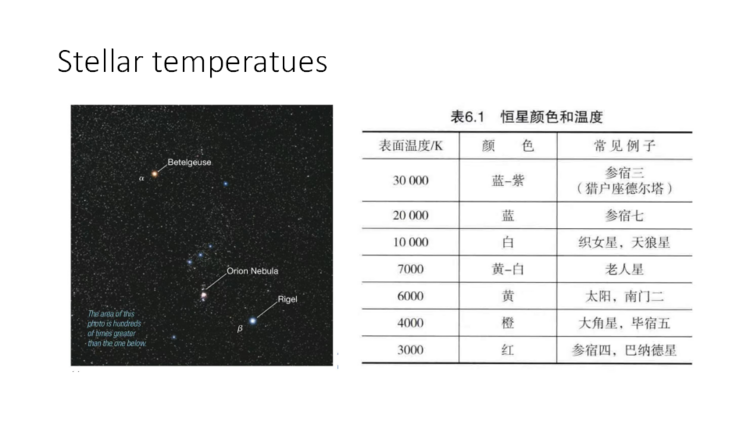
Before studying astronomy, many people—including me—assume that red stars are hot and blue stars are cool. Perhaps you still think so as you read this. In color psychology, red feels warm, like flame, while blue feels cold, like an ice cave. Those impressions usually match everyday experience, so why do stars seem to defy common sense? The answer lies in the relationship between color and the blackbody curve. Enough talk—bring on the diagram.
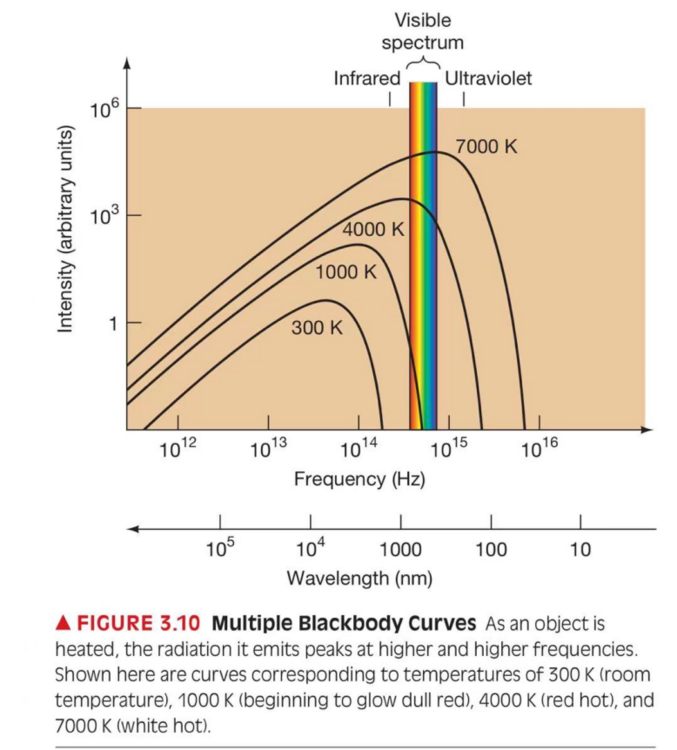
If any science student claims never to have seen this graph, I am ready to argue: it is the blackbody-curve diagram from elective physics. Its conclusion is simple: the hotter a blackbody, the shorter the wavelength—and the higher the frequency—at which its radiation peaks. Red light has a longer wavelength and therefore corresponds to a lower temperature. Blue-violet light has a shorter wavelength and corresponds to a higher one. Astronomers use this principle to measure stellar temperatures. Here is how:
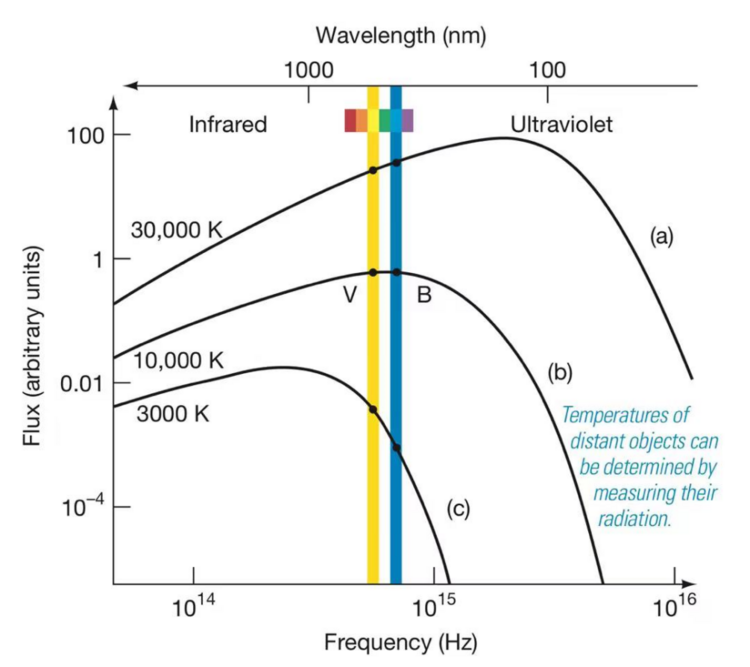
Because we know the basic shape of a blackbody curve so well, astronomers can estimate a star’s temperature from observations at only two wavelengths. Telescope filters block light outside selected wavelength ranges. By measuring the radiation received through filters of different colors—that is, at particular wavelengths—astronomers can fit a blackbody curve and obtain a temperature. This technique is called photometry.
Part 3: Stellar Spectra
When I hear “spectrum,” I first think of the high-school chemistry unit on using spectral analysis to identify elements. Spectra are indeed an important tool for revealing a star’s chemical composition. More formally, spectroscopy is an observational method that combines telescopes with theory. It reflects the internal activity of atoms and lets us infer the properties of matter from the radiation it emits and absorbs.
Before examining stellar spectral lines in detail, let us first lay out the three rules that govern spectroscopy: Kirchhoff’s laws.
- First, a luminous solid or liquid, or a sufficiently dense gas, emits light at every wavelength and therefore produces a continuous spectrum.
- Second, a hot, low-density gas produces a spectrum of bright emission lines characteristic of its chemical composition.
- Third, a cool, thin gas absorbs particular wavelengths from a continuous spectrum, leaving dark absorption lines superimposed on it. These lines are likewise characteristic of the intervening gas and occur at exactly the same wavelengths as the emission lines that gas produces when hot.
With those rules in place, we can turn to the main applications of spectral-line analysis.
A Spectroscopic Thermometer
Deep inside a hot star, atoms are completely ionized. Electrons move freely through the gas, unbound to nuclei, so the radiation spectrum is continuous. Near the comparatively cool surface, however, some atoms retain some or even most of their orbital electrons. As noted above, astronomers can determine a star’s chemical composition by matching the lines they observe with laboratory spectra of known atoms, ions, and molecules. A line’s strength—its brightness in emission or darkness in absorption—depends on the number of atoms producing it. The more atoms that emit or absorb photons at the relevant frequency, the stronger the line. But its strength also depends critically on the temperature of the gas containing those atoms, because temperature determines how many electrons occupy the appropriate orbitals at any moment and undergo a particular transition. At low temperatures, populations tend to accumulate only in low-energy states, and transitions into or out of those states dominate the spectrum. At higher temperatures, more atoms become excited and some may be ionized, fundamentally changing which transitions can occur and therefore the spectrum we see.
Spectroscopists have derived mathematical formulas connecting the number of photons emitted or absorbed to the relevant atomic energy levels and the gas temperature. Once astronomers have measured an object’s spectrum, they compare the observed line strengths with the formulas’ predictions. From that comparison, they can extract both the composition and temperature of the gas that produced the lines.
Measuring Radial Velocity
The spectra of many atoms, ions, and molecules have been established in the laboratory. Familiar patterns of lines often appear in an astronomical spectrum, but those lines may be shifted from their usual positions. In other words, a set may clearly belong to a particular element even though every measured line has moved by the same proportion relative to the laboratory data. This is called a blueshift or redshift. The Doppler effect produces these shifts, allowing astronomers to measure how quickly a source is moving along the observer’s line of sight—its radial velocity.
Spectral Classes
From hottest to coolest, the stellar spectral classes are O, B, A, F, G, K, and M. Astronomers often remember the sequence with the mnemonic “Oh, Be A Fine Girl/Guy, Kiss Me.”

Part 4: The Hertzsprung–Russell Diagram
The Hertzsprung–Russell diagram, abbreviated H–R diagram or HRD, is a scatter plot of stellar absolute magnitude or luminosity against spectral type or effective temperature. Put simply, it places each star on a graph according to its measurable temperature—or color—and luminosity, regardless of the star’s location, as shown below. The related color–magnitude diagram (CMD) plots apparent magnitude against color and is usually used for a star cluster whose members all lie at roughly the same distance.
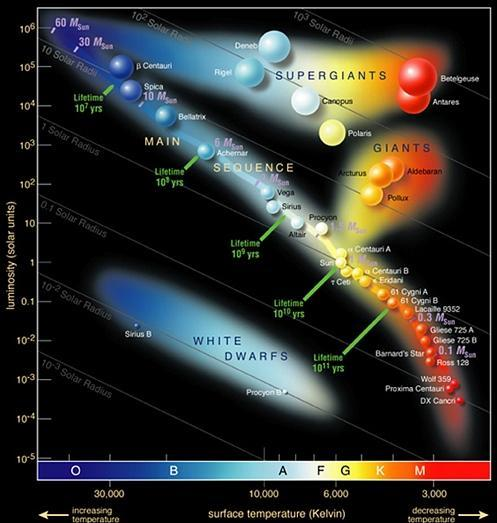
The horizontal axis shows surface temperature, which increases from right to left along the spectral sequence. The vertical axis shows absolute magnitude.
The H–R diagram also displays stellar evolution. About 90% of stars lie in a band running from the upper left to the lower right. This is the main sequence, and the stars within it are main-sequence stars. Moving from top to bottom along the sequence reveals a clear trend:
- Stars at the upper left are large, hot, and luminous. These are blue giants.
- Stars at the lower right are small, cool, and faint. These are red dwarfs.
Red dwarfs may be small and cool, but they are the universe’s champions of longevity. And where is our Sun? It lies around the middle of the main sequence and is called a yellow dwarf.
The molecular clouds from which stars form occupy the far-right region of the diagram. As a cloud begins to contract and heat up, it slowly moves toward the main sequence. Near the end of its life, a star leaves the sequence and moves toward the upper right, the realm of red giants and red supergiants: stars with cool surfaces but high luminosities. A star that passes through the red-giant stage without exploding as a supernova crosses the main sequence toward the lower left. This hot but faint region is home to the white dwarfs. As a white dwarf loses energy, it gradually fades into a black dwarf.
Afterword
The H–R diagram contains an enormous amount of information about stars, and I happen to find it especially interesting—there is my personal bias. I will close with several related terms for curious readers to look up: dwarf star, white dwarf, red dwarf, yellow dwarf, red giant, blue giant, and Wolf–Rayet star, a special kind of blue giant.
This was my first attempt at popular science writing, and I feel that I learned quite a lot. Somehow, it is already four in the morning. It looks as though I will be getting up at noon again.
Written before dawn on the fifth day of the first lunar month in the year Gui-Mao.
References and image sources: Today Astronomy and Baidu Baike
 爱发电(点击图片跳转)